
Will Funds for Water Infrastructure Flow Fairly?
These report cards grade all 50 states on water funding equity.
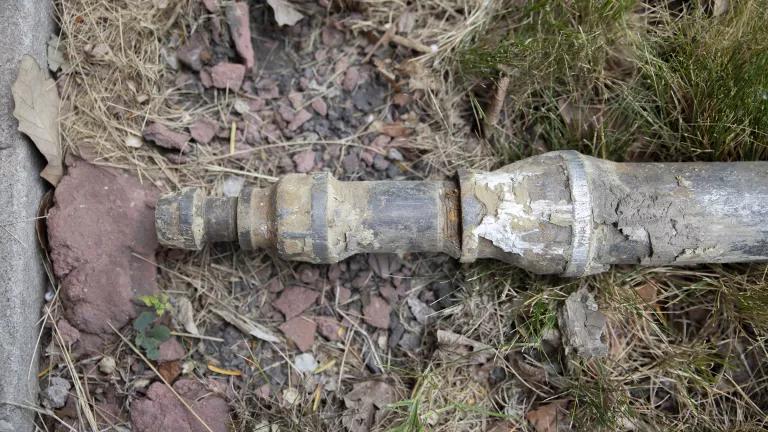
Part of a lead service line removed from outside the home in Chicago
Vanessa Bly Photography


Federal funding for water infrastructure has increased in recent years, but are states doing everything they can to make sure those dollars reach the communities that need them the most? Our new report, Will Funds Flow Fairly? State Water Infrastructure Equity Report Cards, evaluates and grades water infrastructure funding policies in all 50 states to help answer that question. Our findings show there’s room for improvement across the board, and we hope the report will help spur states to examine their policies and ensure that funding is flowing equitably to the communities that most need it.
Disadvantaged communities face challenges accessing water infrastructure funds
From coast to coast, America’s water and sewer systems are struggling. Pipes and treatment plants are aging. Extreme storms are becoming more frequent. The population is growing in some areas and shrinking in others, while contamination from lead and PFAS “forever chemicals” triggers an urgent need for improved treatment and modernized infrastructure. All of these factors are putting immense strain on our water systems.
Yet these challenges affect certain communities more severely than others. Many low-wealth people and people of color live without access to properly functioning wastewater treatment, and drinking water violations are disproportionately high in low-income communities and communities of color. Addressing these problems costs money—resources that the hardest-hit communities often lack.
Fortunately, federal funding is available for building, repairing, and upgrading water infrastructure. All communities should have a fair shot at accessing it, and disadvantaged communities with the greatest infrastructure needs should be first in line. Yet we lack national standards or requirements that would ensure these resources are distributed equitably.
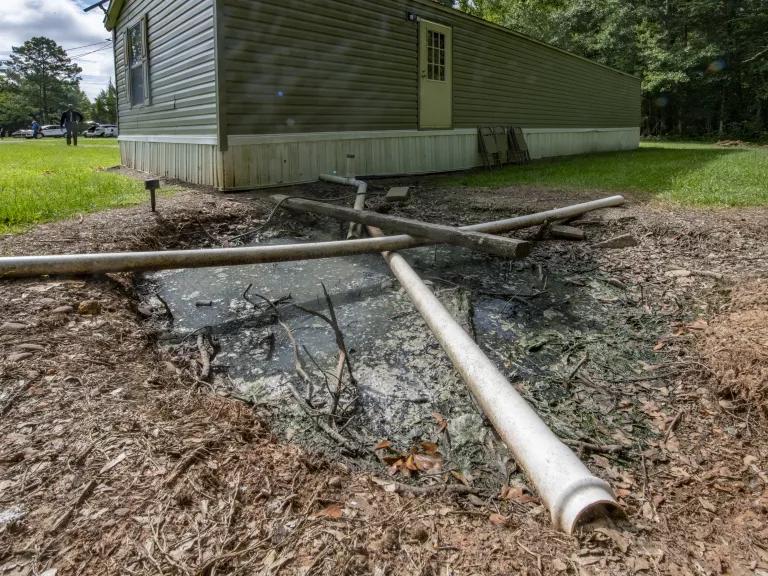
A straight pipe empties sewage into the backyard of a home in Lowndes County, Alabama.
Lance Cheung/USDA
Most federal water infrastructure funds flow through the State Revolving Fund (SRF) program. The SRF is a federal-state partnership in which Congress appropriates money each year that’s divided among the states. Each state then distributes those funds to communities—typically in the form of low-interest loans—according to its own set of policies and priorities. A portion of these funds are reserved for grants (often called "forgivable loans”) to disadvantaged communities.
These policies vary widely from state to state—in fact, they often differ between the Clean Water SRF and Drinking Water SRF funding streams within the same state. State policies can prioritize different types of projects and applicants, offer different interest rates and other loan terms, and provide different amounts of “additional subsidization” (grants and forgivable loans that don’t need to be repaid). All of these policies affect how hard or easy it is for different kinds of communities to access funding. As a result, they have a significant influence on equity in the program.
Recent analyses have revealed problematic trends in states’ ability to direct funds to disadvantaged communities. NRDC’s 2022 report A Fairer Funding Stream: How Reforming the Clean Water State Revolving Fund Can Equitably Improve Water Infrastructure Across the Country, developed in collaboration with the Environmental Policy Innovation Center (EPIC), found that smaller municipalities and those with larger populations of color were statistically less likely to receive assistance through the Clean Water SRF between 2011 and 2020. These results were consistent with EPIC’s 2021 analysis of Drinking Water SRF awards.
Because of those findings—and the fact that a surge of supplemental funding through the Bipartisan Infrastructure Law of 2021 has increased scrutiny of the SRF—we decided to take a closer look at the state policies that guide the distribution of these funds. Our goal was to identify the degree to which states are incorporating equity into their programs and to identify opportunities where they can improve.
Our report card gives every state a grade on its water infrastructure funding equity
To accomplish this goal, we developed a list of 16 policies that affect disadvantaged communities’ ability to access SRF funds. We chose policies that we could evaluate on a standardized yes/no basis. We considered policies that govern Clean Water SRF and Drinking Water SRF award decisions, as well as the separate policies that states use when deciding how to allocate SRF resources for lead service line replacement projects.
While these certainly aren’t the only state policies that can affect equity in funding distribution, considered together, they indicate whether a state is taking steps to ensure that all kinds of communities are able to access the resources they need.
Using the states’ most recent SRF spending plans as of December 2023 (when we completed our research), we awarded points to states for adopting these policies. We then summed up their point totals to arrive at letter grades for the state’s Clean Water SRF program, Drinking Water SRF program, and lead service line replacement policies, as well as an overall equity grade.
Only two states earned an overall A grade, with another 10 receiving a B. Most states received a C or D, with two states receiving failing grades. These results—plus the fact that no state received a perfect score—tell us that there’s room for improvement across the board. This is especially the case for states’ Clean Water SRF and lead service line replacement policies, which generally received lower scores than their Drinking Water SRF policies did.
You can read the full report for detailed information on methodology, scores, and grades for each of the 50 states, including one-page state report cards with grades, policy evaluations, and recommendations.
These grades are the beginning of a conversation—and a call to action
It’s important to note that the report evaluates written policies only—we didn’t quantitatively analyze actual funding distribution data. While our assessment suggests whether states have policy frameworks in place that are more or less likely to result in equitable outcomes, it’s up to advocates and policymakers at the state level to monitor award decisions and determine whether disadvantaged communities are receiving the assistance they need.
We hope that the grades assigned in this report card help spur state agencies to take a comprehensive look at their funding data and policies—including those not evaluated in our checklist—to pinpoint where reforms could improve equity. We encourage the U.S. Environmental Protection Agency to support these efforts with guidance and technical assistance. And we urge our fellow advocates to continue holding their states accountable for making progress on this important issue.
Related Resources

EPA’s New Rules for Drinking Water Right-to-Know Reporting Are a ‘Mixed Bag’
Lead on Tap: A Short History of the Failure to Fix One of America’s Worst Water Contamination Crises