
The Environmental Protection Agency (EPA) is developing a proposed rule to address carbon emissions from existing power plants using their Clean Air Act authority. The proposal is being reviewed by other agencies and the White House and is scheduled to be released in early June of this year. The administration has an opportunity to reduce carbon dioxide (CO2) emissions from the electric sector over the coming decades, protect our children and future generations from the worst effects of climate change, and show the world that we can lead the way in cutting dangerous pollution.
Recognizing that states have different generation mixes, EPA is likely to establish state-specific emissions targets or standards of performance for power plants. This is complicated by the fact that all 50 states have very different electric generation and emissions trends, with some having diverse and changing sources of power and others reliant primarily on one fuel type, and with some more carbon-intensive than others. EPA will need to establish emissions trajectories that are linked to the pre-existing generation and emissions mix in each state and the state-specific opportunities for cost effective emissions reductions from the system over time.
There will be extensive modeling completed by EPA to help establish these state standards, but I have often felt that it’s easiest to look at a future reduction target in relation to existing emissions trends. To that end, we have developed a State-by-State CO2 Emissions Tool that allows users to examine historic state emissions trends and possible targets over time in relation to a wide range of baseline periods.
The tool allows users to examine targets based on three different metrics: fossil emissions intensity (CO2 emissions/fossil generation), total intensity (CO2 emissions/total generation including non-emitting), and mass (tons of CO2).
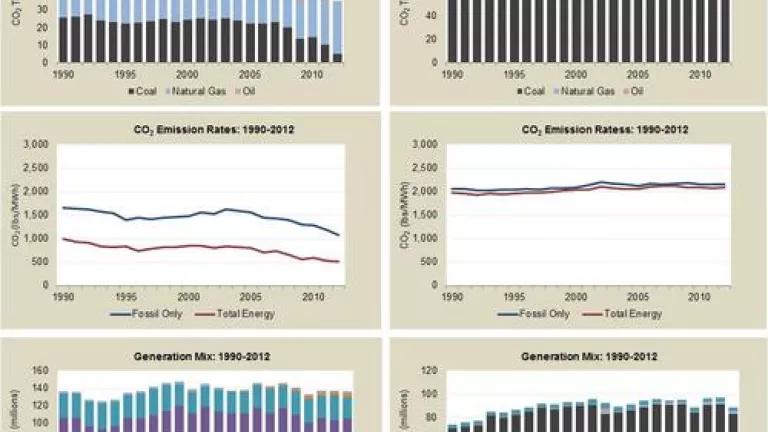
To illustrate the differences in generation and emissions trends, the tool can be used to compare historic data for any state or the U.S. as a whole.
For example, the following figures depict total emissions, emissions intensity, and sources of generation for New York and Kentucky. As the figures illustrate, Kentucky’s emissions have been relatively stable over the past ten years with electricity generated almost exclusively from coal. In contrast, the State of New York’s emissions have declined significantly in that same period, with more generation from natural gas and significantly less from oil and coal.
This allows you to assess each state’s emissions “starting point” and historical trajectory (up, down, or stable), in order to assess goals going forward.
New York Kentucky
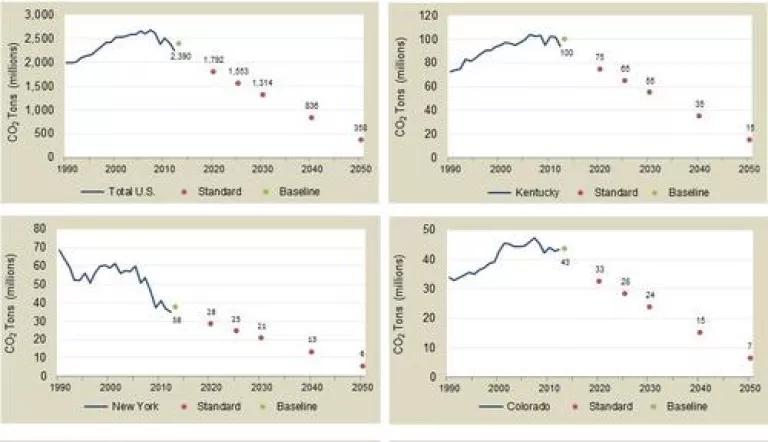
Having established historic, baseline trends and overall emissions trajectories, the tool can then be used to prospectively examine emissions standards or targets using different rates of change in comparison to different historic baseline periods.
In the examples below, a recent multi-year period (2010-2012) is used to set a 25% reduction from that three-year baseline period by 2020, followed by a 2% reduction per year after 2020 for the US, Kentucky, New York and Colorado.
Example Targets based on a Fossil Intensity Standard (lbs/MWh)


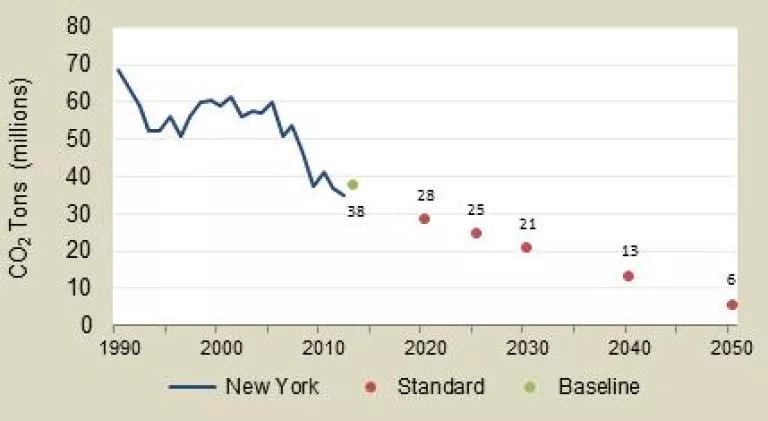
The baseline year chosen by EPA is clearly important to some states where emissions levels or rates have changed over time. Choosing a different baseline period could lead to the standard being easier or harder to achieve.
For example, a 2004-2006 baseline for New York looks very different than a 2010-2012 baseline, using the same 25% reduction by 2020 as shown in the figures above.
New York Mass-based w/ 2004-2006 Baseline

When setting pollution reduction targets, both the baseline and the rate of reduction affect how achievable a given reduction target is in the short term. However, it is the rate of change (or the downward slope of the trajectory) that is the more important factor over the long term.
The EPA has the hard task of assessing 50 different emissions scenarios, unique to each state’s energy mix. This tool may help demystify that process and show that reasonable and fair formulas can be found that deliver cost-effective reductions in emissions across the electric sector and in all states.