We all know that our water comes out of the tap, but do we know how it got there? Many of us who work on California’s water issues weren’t surprised to learn that recent polling data released last week showed that the majority of Californian’s don’t know what the Bay-Delta is.
I’m guessing most everyone who reads this blog knows what the Delta is and why it’s important. But if you’re reading this and don’t know about the Delta, here’s a short movie that NRDC produced that interviews fishermen and farmers about the Bay-Delta and why we work to protect this estuary:
And on Sunday, the San Francisco Chronicle published an Op-Ed I wrote on California’s water myths and facts (available online here). It’s impossible to fit everything you want to say and still meet the word limit, so there were a great many things that had to get cut. You also don’t get to include graphics, and I wanted to share three graphics that I think help tell the story.
The first graphic (see Question # 6 in my Op-Ed) shows that data from the California Department of Water Resources (Water Plan Update 2009) there is more new water supplies available from investing in water recycling, agricultural and urban efficiency, stormwater capture, groundwater cleanup and conjunctive use, and similar tools than California has ever exported from the Delta. These tools are some of the most cost-effective and drought-proof new sources of water supply available.
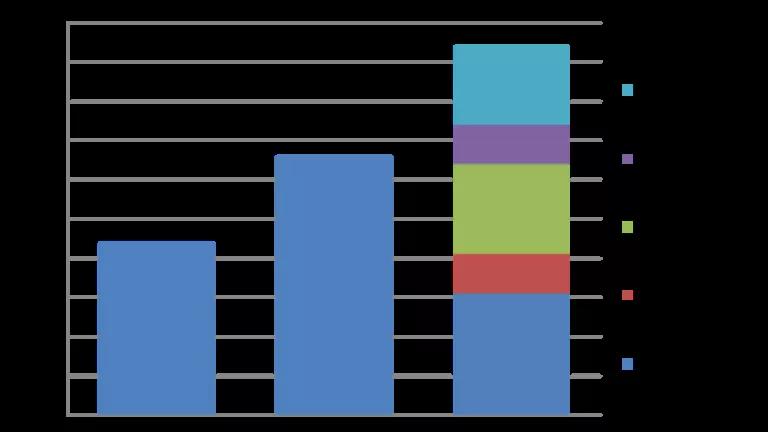
The second graphic (Question #2 in my Op-Ed) shows the amount of water exports from the Delta by the State Water Project and Central Valley Project over the years, including the average level of diversions under the current biological opinions that regulate operations. It shows that current operations are about the same as the long term average, albeit lower than the record levels of diversions during the 2000s (when native fish populations plummeted). Flow is not the only factor affecting fish populations, but it is one of the most important factors (and one of the most controversial). By the same token, water exports from the Delta aren't the only source of supply for most water districts, and many districts (particularly in Southern California) are planning to take less water from the Delta, as my colleague Barry Nelson has been blogging about recently.

The third graphic (Question #4 from my Op-Ed) shows the abundance index for Delta smelt increasing last year to its highest level in nearly a decade. There’s no question that Delta smelt and other native fish haven’t recovered, and are still a fraction of their historic population levels (smelt historically were one of the most common fish found in the Bay-Delta). But the good news is that we’re making some progress in restoring salmon and other native fisheries in the Bay-Delta watershed. And that’s good news for everyone.
