
With comprehensive climate and energy legislation moving forward in the U.S. Senate, there has been a lot of attention paid to how this will impact offshore drilling, our nuclear energy industry, and the coal industry. What has been largely left out of the discussion is how this legislation will affect how much money drivers spend on gasoline. NRDC has just performed an analysis that shows Americans will have lower household transportation fuel bills in the next decade. Under federal climate-protective policies that include an economy-wide cap on carbon pollution and the recently-approved improved efficiency standards for passenger cars and light trucks, households across the country will, on average, consume less gasoline and save money.
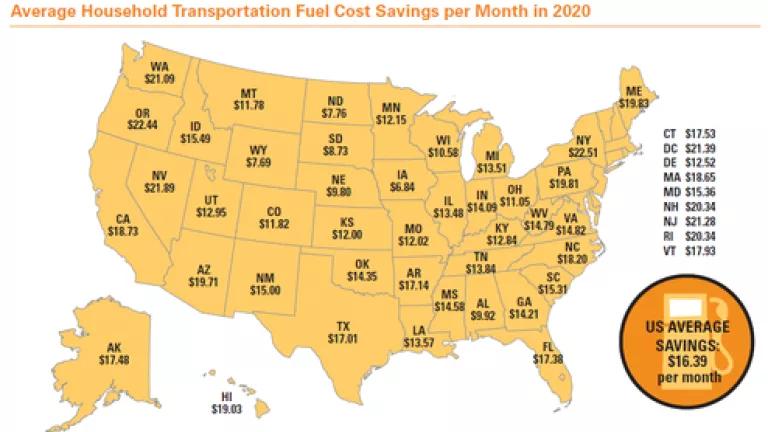
In the aggregate, Americans can expect to save over $24 billion in vehicle transportation costs in 2020, a household average of about $16/month. State-level average monthly household fuel bills vary by state populations and fuel consumption. In all states, however, households save money.
Click here for a larger version of the map.
Methodology and Assumptions
The bulk of the average American household’s transportation costs come from owning and operating personal vehicles, such as cars, minivans, SUVs, and pickup trucks. We calculate the savings to households in 2020 by taking the difference in the cost of driving a fleet made up primarily of vehicles that get the same fuel economy as the average new vehicles sold today (base case) and the cost of purchasing and driving more efficient vehicles with a carbon cap in place (higher efficiency + climate bill case).
The cost of driving is simply the product of fuel consumption and gasoline prices. For both the base and higher efficiency vehicle cases, we start with gasoline prices as projected by DOE’s Energy Information Administration (EIA). When calculating the transportation cost of the more efficient fleet, however, we adjust the cost to include two counteracting effects: (1) fuel prices increase because of the carbon cap under comprehensive climate and energy legislation (about 7% in 2020), and (2) fuel prices decrease because a reduction in U.S. oil demand puts downward pressure on world oil prices, and therefore state gas prices. It should be noted that, even without the cost-reduction effect in (2), all states have net savings.
Fuel consumption for the base and higher efficiency cases is determined by dividing EIA mileage projections by projections of on-road vehicle efficiency (in miles per gallon), which come out of a national vehicle stock turnover model developed by NRDC. For this analysis, the 2020 national consumption is then allocated to states in proportion to state-level household projections. State-level fuel costs are calculated by multiplying a state’s consumption by the gasoline prices for that state’s region. Finally, average state household costs are determined by state costs by 2020 household projections. (More details on the assumptions are below.)
While not part of this analysis, future increases in vehicle efficiency, in concert with comprehensive clean energy climate legislation, will likely save households even more on their fuel bill in 2020 and beyond and result in more jobs. That is because future cars using cost-effective fuel-efficient technology will reduce fuel consumption even further than calculated above. According to a recent joint NRDC-UAW-CAP study, applying the technology to make cleaner, more efficient cars creates quality, auto-related manufacturing jobs. With the right incentives in a climate bill we can make sure those jobs are American jobs.
Detailed Assumptions
Vehicle Efficiency
The Environmental Protection Agency (EPA) and National Highway Traffic Safety Administration (NHTSA) recently enacted new vehicle standards of 35.5 mpg for MY 2016. The savings in our calculations reflect a comparison of these new standards with a fleet that remains at 2009 levels for passenger vehicles. The improved fleet increases linearly from 2009 to reach the 2011 NHTSA Corporate Average Fuel Economy (CAFE) levels and then rises from 2012 to 2016 levels according to the EPA/NHTSA Light-Duty Vehicle Greenhouse Gas Emission Standards and Corporate Average Fuel Economy Standards for MY2012-MY2016 finalized on April 1, 2010.[1] In 2020, approximately 70 percent of on-road vehicles will be from MY2012 or newer.[2]
Gasoline Prices
State gasoline prices for the base case are assumed to equal the regional prices for the region in which the state is located, as reported by EIA’s Annual Energy Outlook 2010 (Early Release, December 2009).[3] In the higher efficiency + climate bill case, those base case gasoline prices are increased in proportion to the carbon content of gasoline using allowance prices (in $/MTCO2e) from the Congressional Budget Office for H.R. 2454[4] to 2019 and then increasing at 5 percent per year. Also in the higher efficiency + climate bill case, we account for the fact that changes in U.S. oil demand can affect world oil prices and therefore U.S. gasoline prices. Today, the U.S. consumes nearly a quarter of world daily production and a reduction in demand from driving more efficient vehicles will lower worldwide demand and therefore oil prices. We adopt the EPA/NHTSA estimates that the drop in fuel prices due to the new standards is equivalent to $0.28 per gallon.[5] However, as mentioned above, even with this price reduction excluded from the analysis, households in all states still save money on their monthly fuel bills in 2020.
Vehicle Costs
The technology to make more efficient vehicles increases the price of the vehicles. EPA and NHTSA estimate that MY2016 vehicles that average the CO2 pollution equivalent of 35.5 mpg will cost approximately $948 more than today’s vehicles. NHTSA estimates that achieving the shorter run MY2011 standard will cost less, at $91 per vehicle.[6] We use EPA estimates for MY2012-2016 vehicle costs and include costs due to increased sales tax and insurance premiums.[7] We also assume that the incremental cost is not paid for entirely upfront but is included in a 5-year loan with a 7 percent interest rate. We allocate the more efficient vehicle incremental costs to individual states according to an estimate of new vehicles sales in each state. We use the EIA AEO 2010 projection of national sales and assign each state a share of the sales according to a recent breakdown of vehicles per state provided by Ward’s Automotive Group (based on 2006 data).[8]
[1] EPA/NHTSA MY2012-2016 Final rule available at http://www.epa.gov/otaq/climate/regulations.htm.
[2] Estimate from NRDC light duty vehicle stock turnover model.
[3] Available at http://www.eia.doe.gov/oiaf/aeo/index.html. Using motor gasoline retail prices.
[4] Available at http://www.cbo.gov/doc.cfm?index=10262&zzz=39057.
[5] EPA/NHTSA MY2012-2016 Final Rule, Table III.H.8-1. Assumes 42 gallons per barrel.
[6] NHTSA, MY2011 CAFE Final Rule, FR 14196 at 144413.
[7] EPA/NHTSA MY2012-2016 Final Rule, Tables I.C.2-6 and III.H.5-3.