Food Rescue Client Survey Guide
A core aim of NRDC’s work in the food rescue space is ensuring that the voices of those who seek food assistance are integral to community dialogue about the future of a city’s food rescue system. One of many potential strategies for engaging food assistance clients is to conduct periodic surveys seeking feedback on issues like satisfaction with the quality and cultural appropriateness of the food offered, barriers to accessing food support, and suggestions for making the city’s food rescue system more nimble, responsive, and reflective of community aspirations. Surveys can be a useful complement to other types of client participation by providing a vehicle to gather significant amounts of qualitative data from large numbers of individuals.
As part of the Food Matters project, NRDC engaged local consultants to design and conduct surveys of food rescue clients (also known as end-users) in Baltimore and Denver. More than 1,000 individuals participated in each of the surveys. In addition to the lessons learned that we discuss below, this guide includes:
- The survey instrument used in Baltimore
- A sample consultant scope of work
- Guidance for volunteers administering the survey
- The results of the Baltimore survey
- The results of the Denver survey (included in Strengthening Denver’s Food Rescue Ecosystem Report)
Strategies we found helpful
NRDC engaged local organizations in Baltimore and Denver to conduct intercept surveys with food rescue clients. Below we highlight a variety of strategies used to design the survey instrument, select survey sites, and administer the survey that we believe contributed to the success of the process. These draw primarily on our experience in Baltimore, where we hired the Maryland Food Bank (MFB) to develop and conduct the client survey. In Denver, we provided a stipend to Hunger Free Colorado to conduct supplemental surveys on our behalf, building on a survey tool and process the organization already had in place.
1. Designing the Survey
- Be sensitive to the length of the survey, and make it as simple as possible. In Baltimore, we designed a survey instrument that could be completed by clients in roughly five to ten minutes. We found this length to be workable for clients and volunteers while providing data on a robust array of issues. In trimming the survey down to that length, we had to cut out a number of lower-priority questions and make sure that the wording and format of the questions were as straightforward as possible to save time and avoid confusion.
- In developing survey questions, consider having survey design specialists review your survey instrument to ensure that it does not introduce undue bias or steer respondents toward particular answers. Including “Does not apply” as an answer choice was particularly helpful in the Baltimore survey as, for example, we asked about the distance traveled and mode of transportation used by clients although some of the survey sites were retirement communities where clients were not traveling to obtain food. Academicians at area colleges can be particularly helpful in shaping an appropriate survey instrument. Please see our Baltimore survey instrument for ideas.
- Test your survey before administering it widely. Before launching the survey process in Baltimore, MFB conducted a test run of the instrument. We asked a focus group, consisting of MFB staff and volunteers, to take the survey and offer feedback. Then we conducted the survey at a local food pantry and collected client feedback there as well. This type of test run is critical for ensuring that any glitches are identified and corrected at the very outset.
- Anticipate the need to translate materials. Your survey instrument and volunteer protocols may need to be translated into languages other than English to reflect the demographics of the community.
- Respect clients’ privacy. The survey instruments we used did not ask for any personal identifying information from respondents out of respect for privacy concerns, particularly among populations that may have concerns about immigration status.
- Take advantage of software to keep track of your results. In Baltimore, we used Survey Monkey to track results and it worked well for our purposes. We needed a premium version of Survey Monkey to accommodate the large number of survey responses.
- Capture data in a way that enables analysis. Survey Monkey automatically provides charts summarizing survey data. However, for more sophisticated analysis the data must be exported and manipulated. MFB analyzed the data from Survey Monkey in Microsoft Excel. Mapping of food distribution sites was done using ArcGIS.
2. Selecting Survey Sites
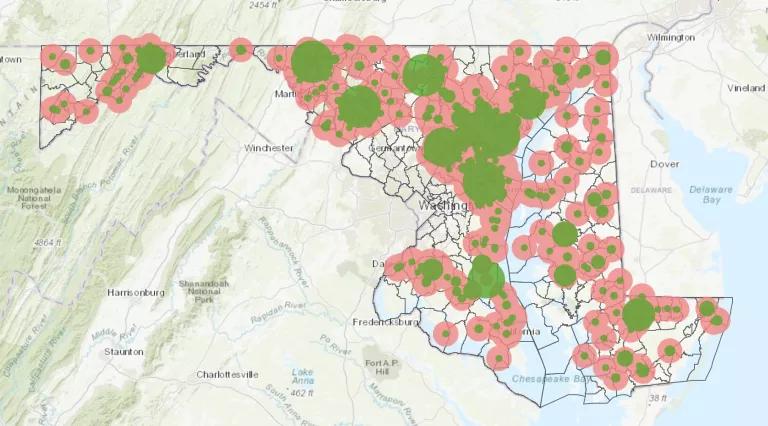
In Baltimore, survey responses were gathered at 29 food distribution sites in 17 neighborhoods. We took a range of factors into account during the site selection process, including:
- The demographic features of potential locations, including racial and ethnic attributes, household income, unemployment rates, prevalence of food insecurity, and others.
- The geographic distribution of locations across the city.
- The capacity of the food distribution site to provide space to conduct the survey on-site, and the staff’s responsiveness to the request to participate.
- The type of site (e.g., pantry, mobile pantry, on-site feeding locations, senior-focused locations, K–12 locations, sites that were part of MFB’s pantry network and those that were not, etc.).
- The type of distribution model (client choice, pre-bagged approach, or a combination of the two).
When constructing your project schedule, allow plenty of time to secure the cooperation of the survey sites. Many pantries and soup kitchens have limited staffing and hours of operation and can be very hard to reach. In Baltimore it took as long as several weeks to secure organizations’ participation.
3. Administering the Survey
- To reach 1,000 clients over a 10-week period, MFB recruited 32 volunteers to administer the survey. They included people from MFB’s staff and volunteer program, as well as students from the Johns Hopkins Bloomberg School of Public Health. All volunteers were given an orientation and trained by MFB’s volunteer program manager on technical aspects of the survey process (e.g., how to use mobile hot spots, Chromebook tablets, and Survey Monkey; how to distribute/track gift cards) and interpersonal skills (e.g., how to interact with clients). The use of a centrally managed pool of volunteers was critical, as many food distribution sites would not have had the capacity to conduct the survey themselves.
- The food bank prepared “survey kits” for volunteers to sign out. They included Chromebooks, styluses, mobile hot spots, paper copies of the survey, and pens, as well as volunteer guidance and a script to be used once the volunteer was on site (see Volunteer Guidance resource).
- All surveys were administered at food distribution sites during times when clients were picking up or eating food (e.g., at soup kitchens). The survey team would usually set up 30 to 60 minutes before clients began to arrive.
- At each site where surveys were conducted, at least one MFB staff member and one volunteer were present.
- MFB purchased three Chromebooks to conduct the survey electronically. However, with only three Chromebooks available, volunteers could survey only three clients at a time, significantly slowing the process. To address this, volunteers switched from using Chromebooks to paper surveys. Clients were given a paper copy of the survey, a clipboard, and a pen and were asked to complete the survey by hand. While using Chromebooks initially appeared to be more time efficient, using paper copies allowed volunteers to survey many more clients at a time. After finishing the survey work at a given location, volunteers input the data from each paper survey into Survey Monkey.
- If literacy challenges arose, a volunteer read the survey out loud to the client and recorded the responses in writing.
- Volunteers who were able to conduct the survey verbally in Spanish were available as needed.
- Clients typically completed the survey while waiting to receive food. This proved more effective than asking clients to participate as they left the food distribution site.
- Clients who completed the survey received a $5 gift card to a local retailer to compensate them for their valuable time and perspective. Before giving the client the gift card, the volunteer checked the survey for completeness. This quality check was very important as clients would sometimes rush through the survey and miss entire pages or skip some questions. We found that taking a moment to review the survey with the client improved the quality and completeness of responses. It also reinforced to the client how important his or her opinion was.
- It is important to have a protocol in place to ensure that each client is surveyed only once. The Maryland Food Bank addressed this by visiting each survey site only once. Given the geographic diversity of the sites, this reduced the risk of multiple responses from the same client. In addition, MFB asked all potential survey respondents if they had taken the survey previously.
- Surveys were conducted in private if space at the food distribution site allowed. This was done out of respect for the client’s dignity and privacy and had the added benefit of reducing distractions, thereby making the survey process faster and easier.